1. Build operating model
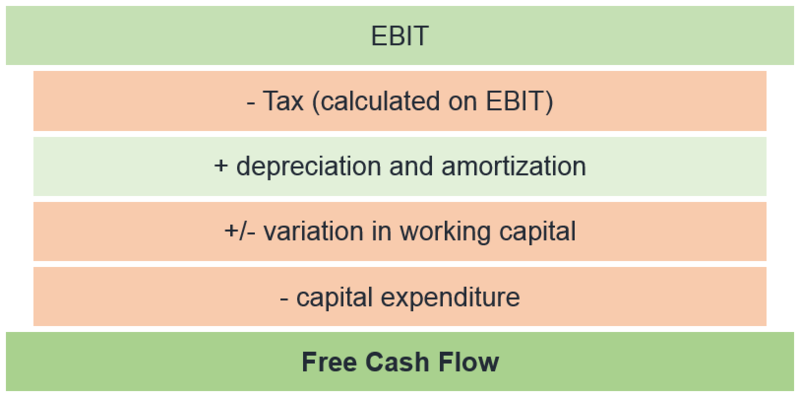
Build the operating model for the target company. The most important financial aggregates will be the ones which will allow you to calculate a detailed cash flow before debt service (payments of debt principal and interests). The LBO transaction implies a completely new capital structure (more debt and more diverse tranches of debt). You will want to know if the company can support the new cap structure!
2. Valuation
Once you have the key financials, you need to know how the company is worth. Here it’s a usual valuation exercise: comps (precedent transactions and trading comps) and DCF.
3. Sources and uses
When you know how much the company is worth, you need to know how much the financial sponsor will pay for it in total: don’t forget transaction costs – it’s not free to raise debt and you will have to pay advisors (legal, financial etc..).
This step requires to think about the structure of the transaction: how much debt can you put in the transaction? What type of debt? And ultimately, what is the equity check (what the PE shop will have to put on the table)?
You will be able to answer these questions by looking at recent transactions in the same sector, by judging the appetite of banks in financing the asset etc…
4. New capital structure, new set of forecasts
When you have your new capital structure, you can then modify the operating model of the company: new interests to be paid, new type of debt to be repaid.
The forecasts will start from what is called “pro-forma” financial (pro-forma for the transaction).
5. Credit statistics
Once you have your new set of forecasts, it is very important to know if it works! By “it works”, we mean “can the company support the heavy amount of debt?”. Credit statistics are some of the most important measures in a LBO, you will calculate ratio such as leverage or interest cover ratio in order to see 1) if the company can repay the debt and 2) if the company can repay the debt quickly. If the company can’t support the capital structure you set up, you have to modify it (lower the debt, use other debt instruments – loan, PIK note, high yield bonds etc…).
6. Returns
When you have your sustainable capital structure, you need to calculate the returns for the financial sponsor. 2 key measure of return: 1) Cash on cash (“CoC” multiple) – you invested £100 and you get back £200 when you liquidate your investment, you made a 2.0x CoC – and 2) Internal rate of return (“IRR”) which a value of return in percentage and taking into account the factor time.
Bear in mind that expected returns vary in function of the type of financial investor. A pension fund will expect a 10%-14% IRR while a Venture Capital firm will expect at least 30%-40%.


 Cash on cash is an absolute measure of the return from an investment (you invest $100 and you get back $200, your CoC is 2.0x).


